Should you invest in local fixed income, or in U.S. stocks?
Find out how a small allocation can boost your returns. Based on 18 years of data, we show you the strategy for your profile. Click to learn more.
Executive summary 💡
U.S. stocks have delivered remarkable returns for Latin American investors, generating over 1,600% for Brazilians and nearly 1,200% for Mexicans since 2007, decisively outperforming local bonds.
Across 100,000 simulations, no portfolio with a 20% allocation to U.S. stocks ever lost money over any time period, making it a historically safe way to enhance returns.
Allocation Strategies by Time Horizon:
Risk-Averse / Short-Term (1-3 Years): 20% in U.S. stocks.
Balance / Medium-Term (3-7 Years): 50-70% in U.S. stocks.
Risk-Tolerant / Long-Term (7+ Years): 90-100% in U.S. stocks.
While higher returns from U.S. stocks come with greater volatility, a modest allocation to U.S. stocks has historically been an excellent strategy to drive portfolio growth, even for conservative investors.
Before investing, it is essential to first build an emergency fund of 3-6 months' worth of living expenses in local, low-risk investments.
With market-leadering foreign exchange rate, portfolio advisory, and integration with digital assets, Vest is building the definitive solution for global investors seeking higher returns
Should you invest in local fixed income, or in U.S. stocks?
The tradeoff between the two becomes particularly difficult when local interest rates are high, as they have been for the past couple of years. Why take on the volatility of the U.S. stock market and currency fluctuations when local bonds are offering safe, double-digit returns?
What follows is a definitive analysis, based on 18 years of data, of the tradeoffs involved in investing in fixed income versus U.S. stocks from both Mexico and Brazil, Latin America’s two largest economies. We picked these markets (a) because we have lots of users in them, and (b) because their governments provide high-quality, publicly accessible datasets.
By the end, you should have a much clearer idea of how U.S. stocks fit into your own personal financial plan. If you are a Vest customer but are not Mexican or Brazilian, compare the interest rates on government bonds available to your in your own local economy: the higher they are, the more relevant the tradeoffs we explore here are to you.
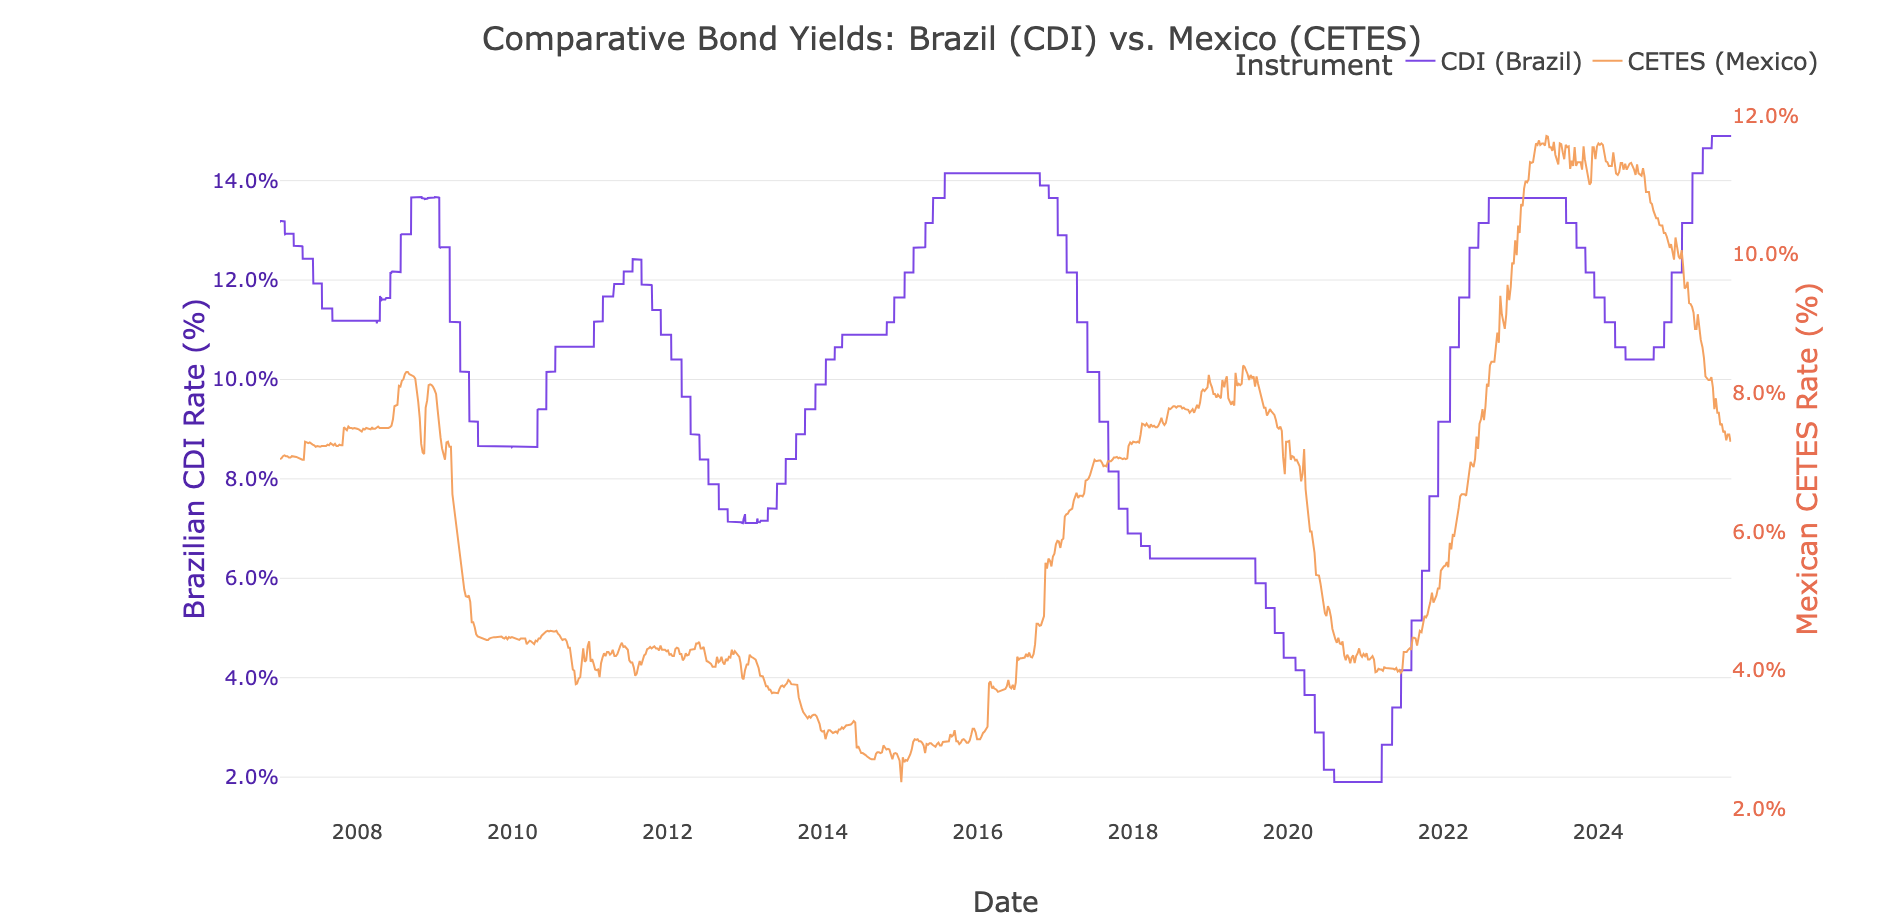
The economy 🌎
Interest rates surged during the COVID 19 pandemic, and today are near decades-long highs–albeit coming down quickly in Mexico:
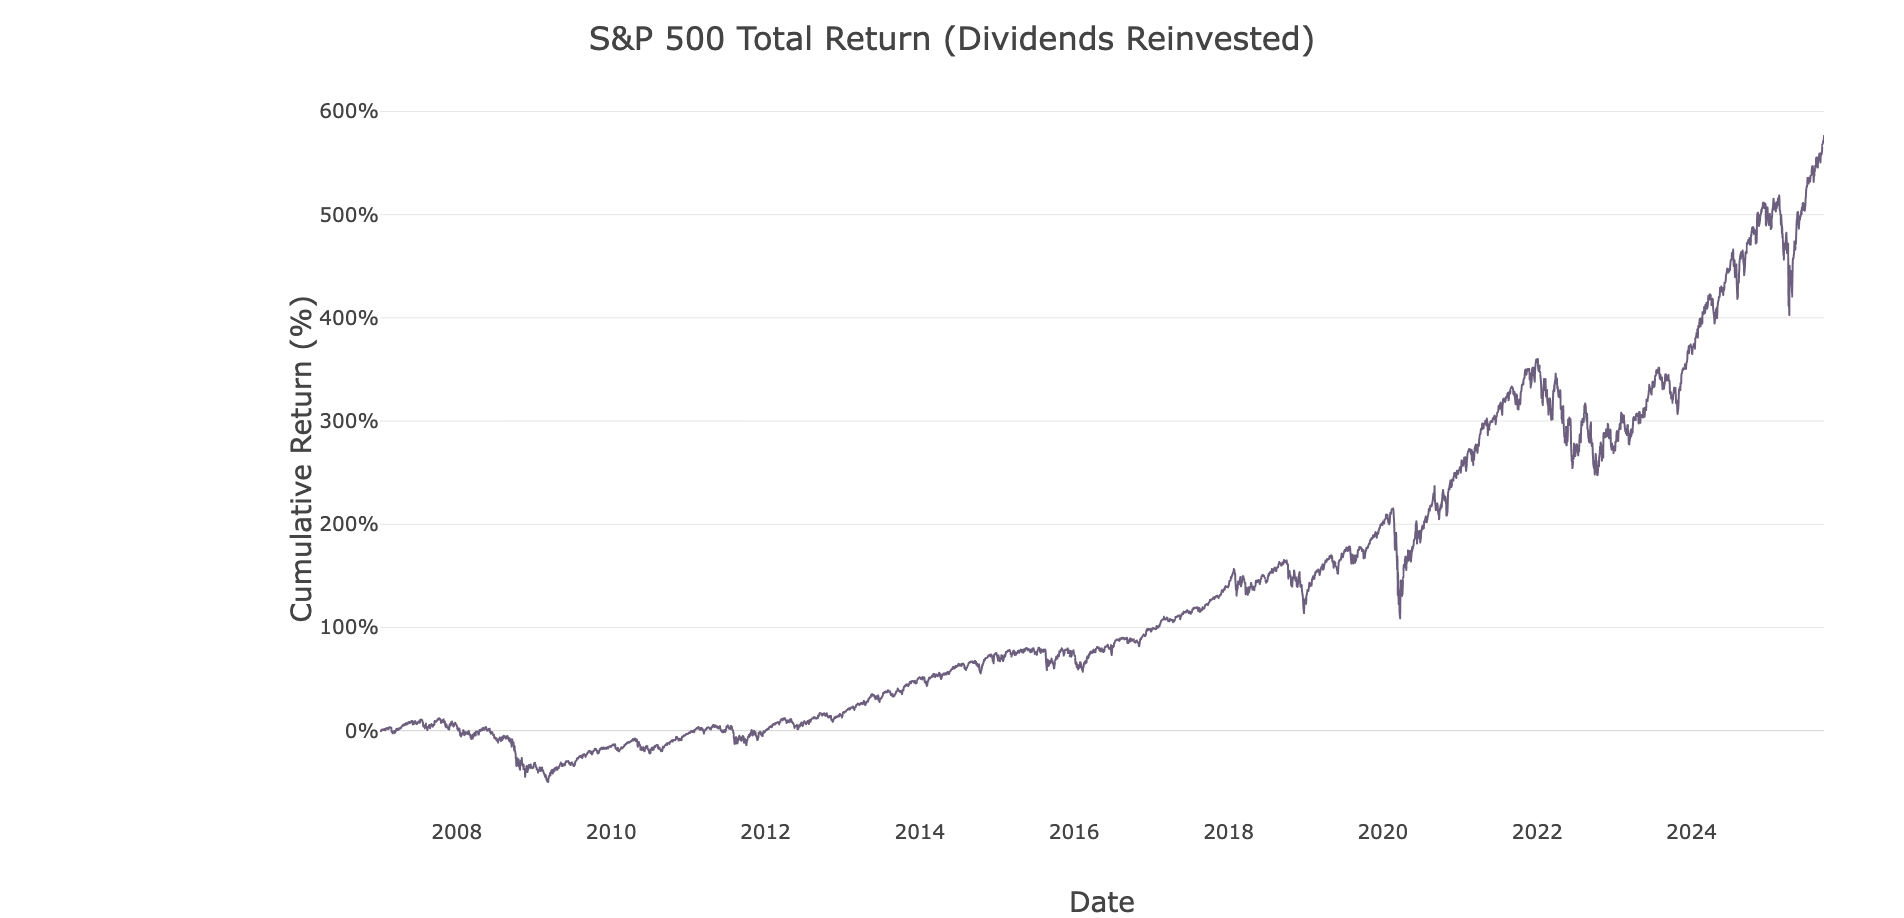
Since recovering from the 2008 financial crisis, U.S. stocks have been on a multi-decade long bull run as well, which was supercharged by stimulus from the COVID 19 pandemic. The performance of U.S. equities over the full study interval is impressive, turning $100USD into over $600USD over the interval since January 2007:
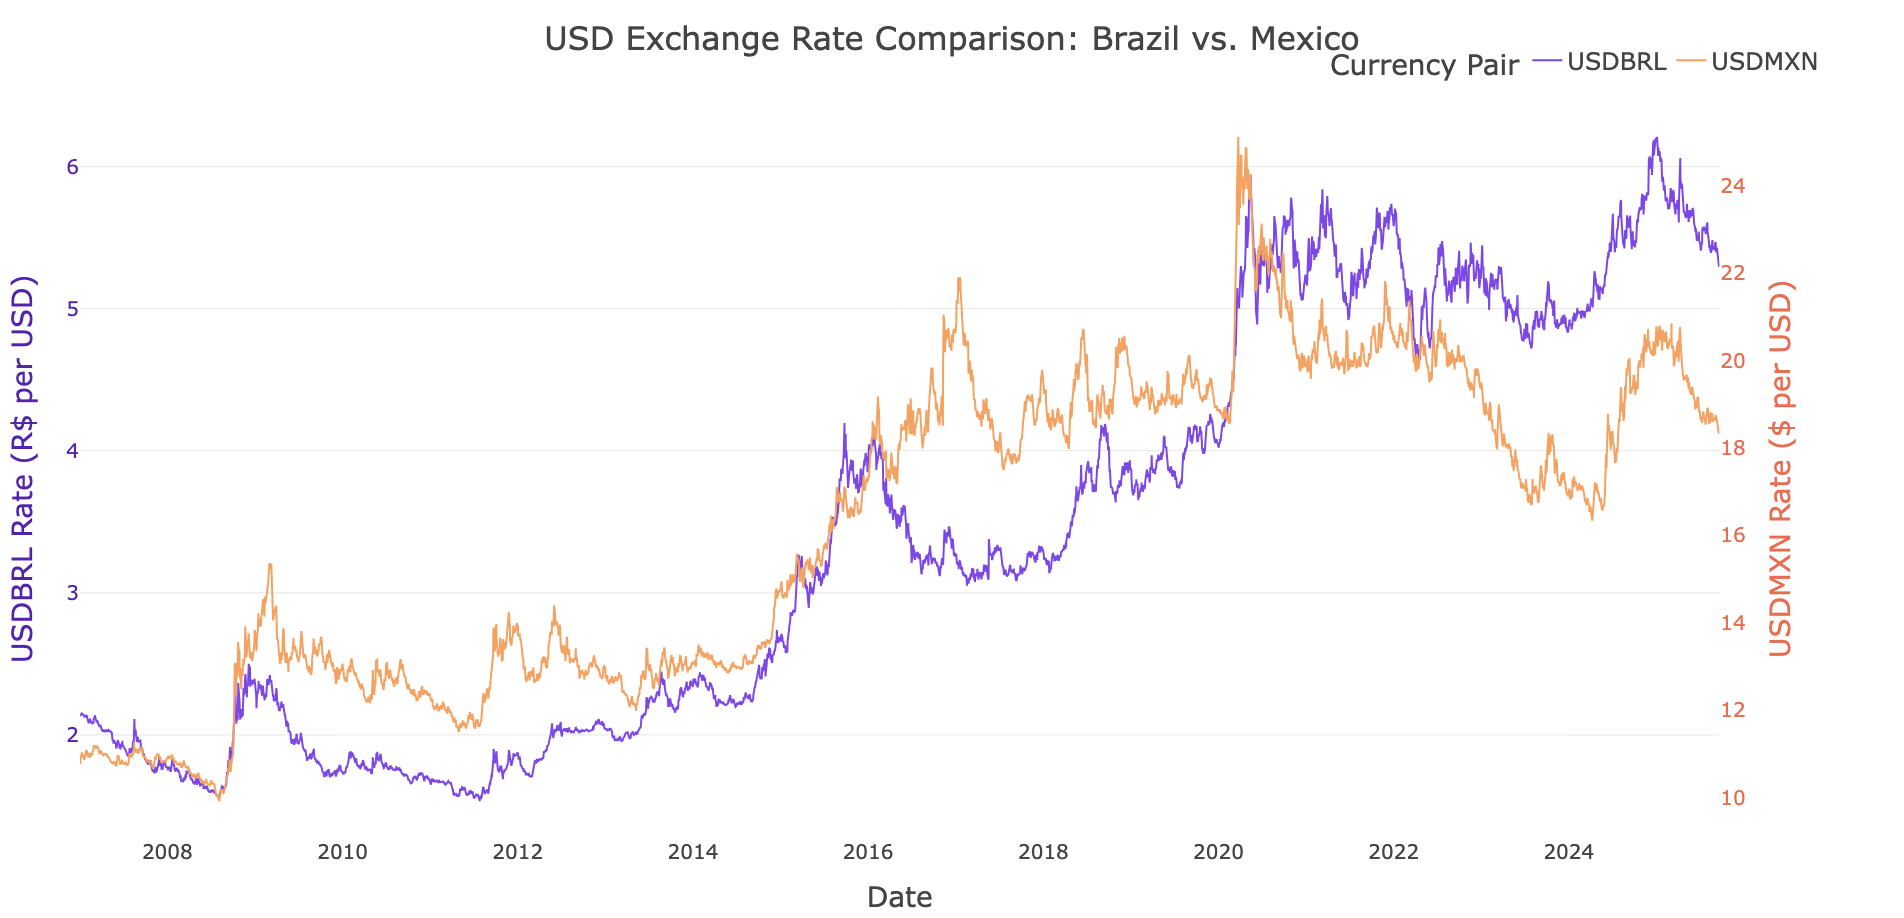
For a Brazilian or Mexican investor, holding U.S. stocks is also a position in the U.S. dollar, which has appreciated substantially over the study interval. More recently, since COVID, the peso has essentially broken even against the dollar, while the BRL depreciated considerably:
So you choose the smooth, predictable, and highly attractive returns of local bonds? Or do you embrace the volatility of a historic U.S. bull market to capture even higher growth and hedge your currency risk?
Study methodology 🔬
To calculate the return from investing in the U.S. stock market we converted the cumulative returns from the S&P500 with compounded dividends, and converted those returns into BRL and MXN at historical exchange rates. This gave us an “apples-to-apples” comparison in local currency. Here’s how it looked over the entire interval:
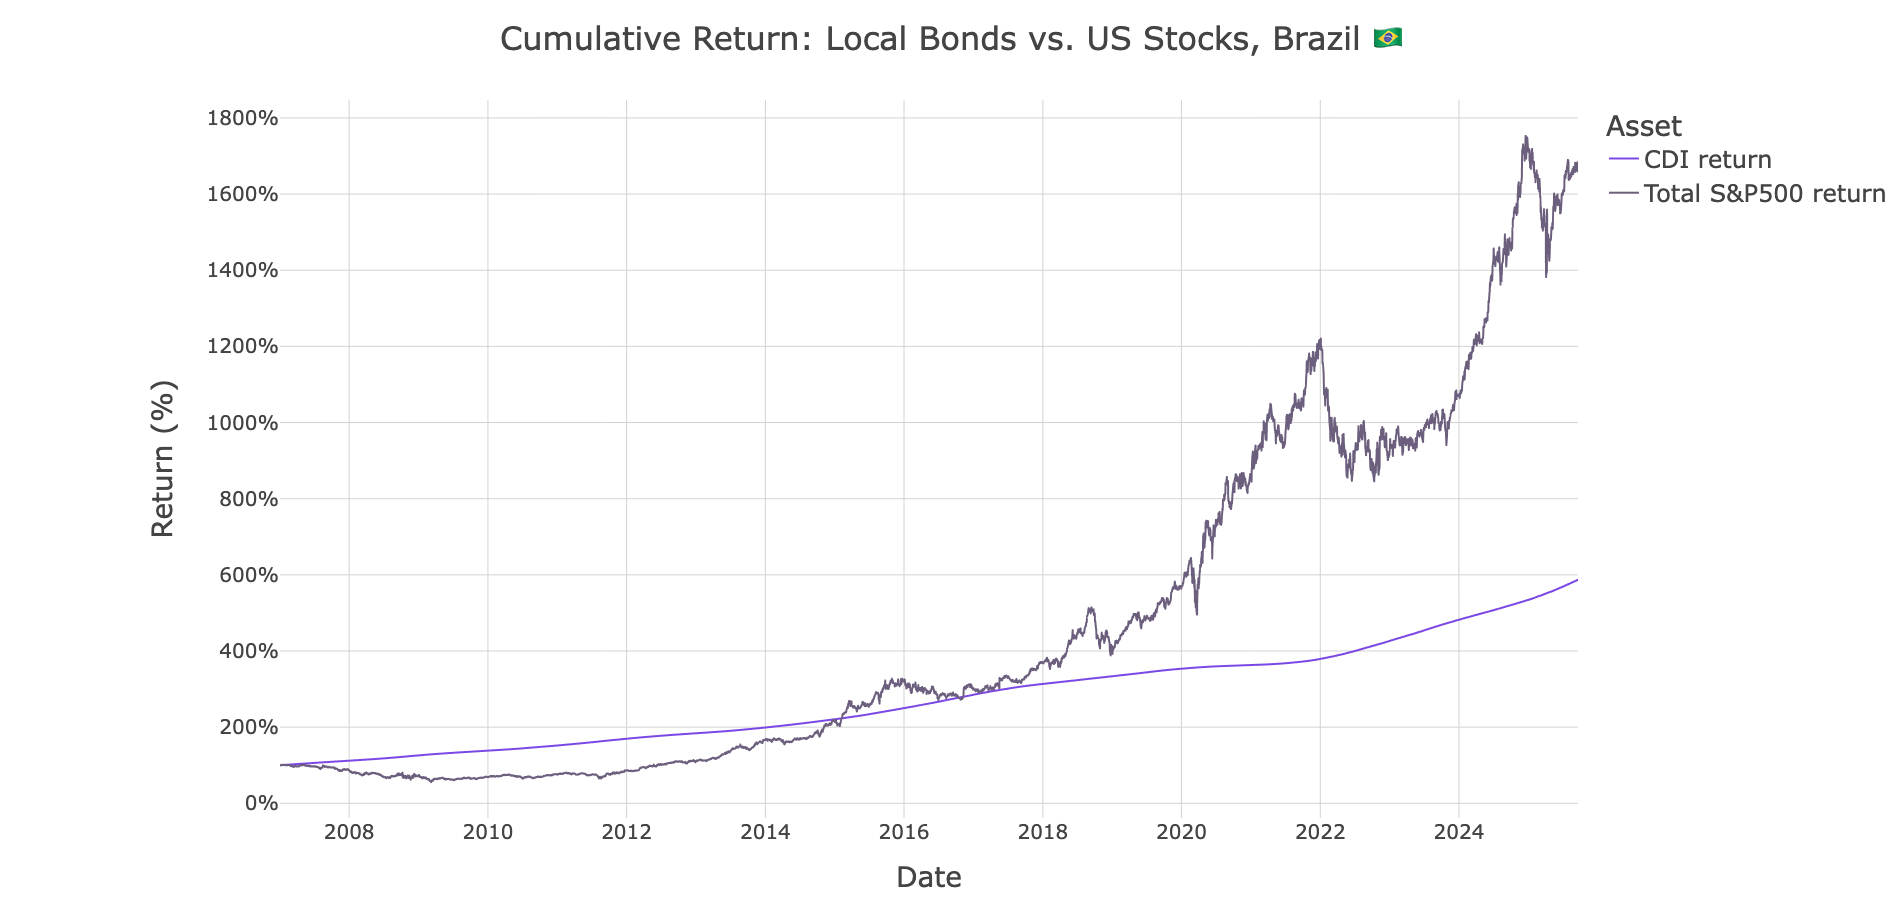
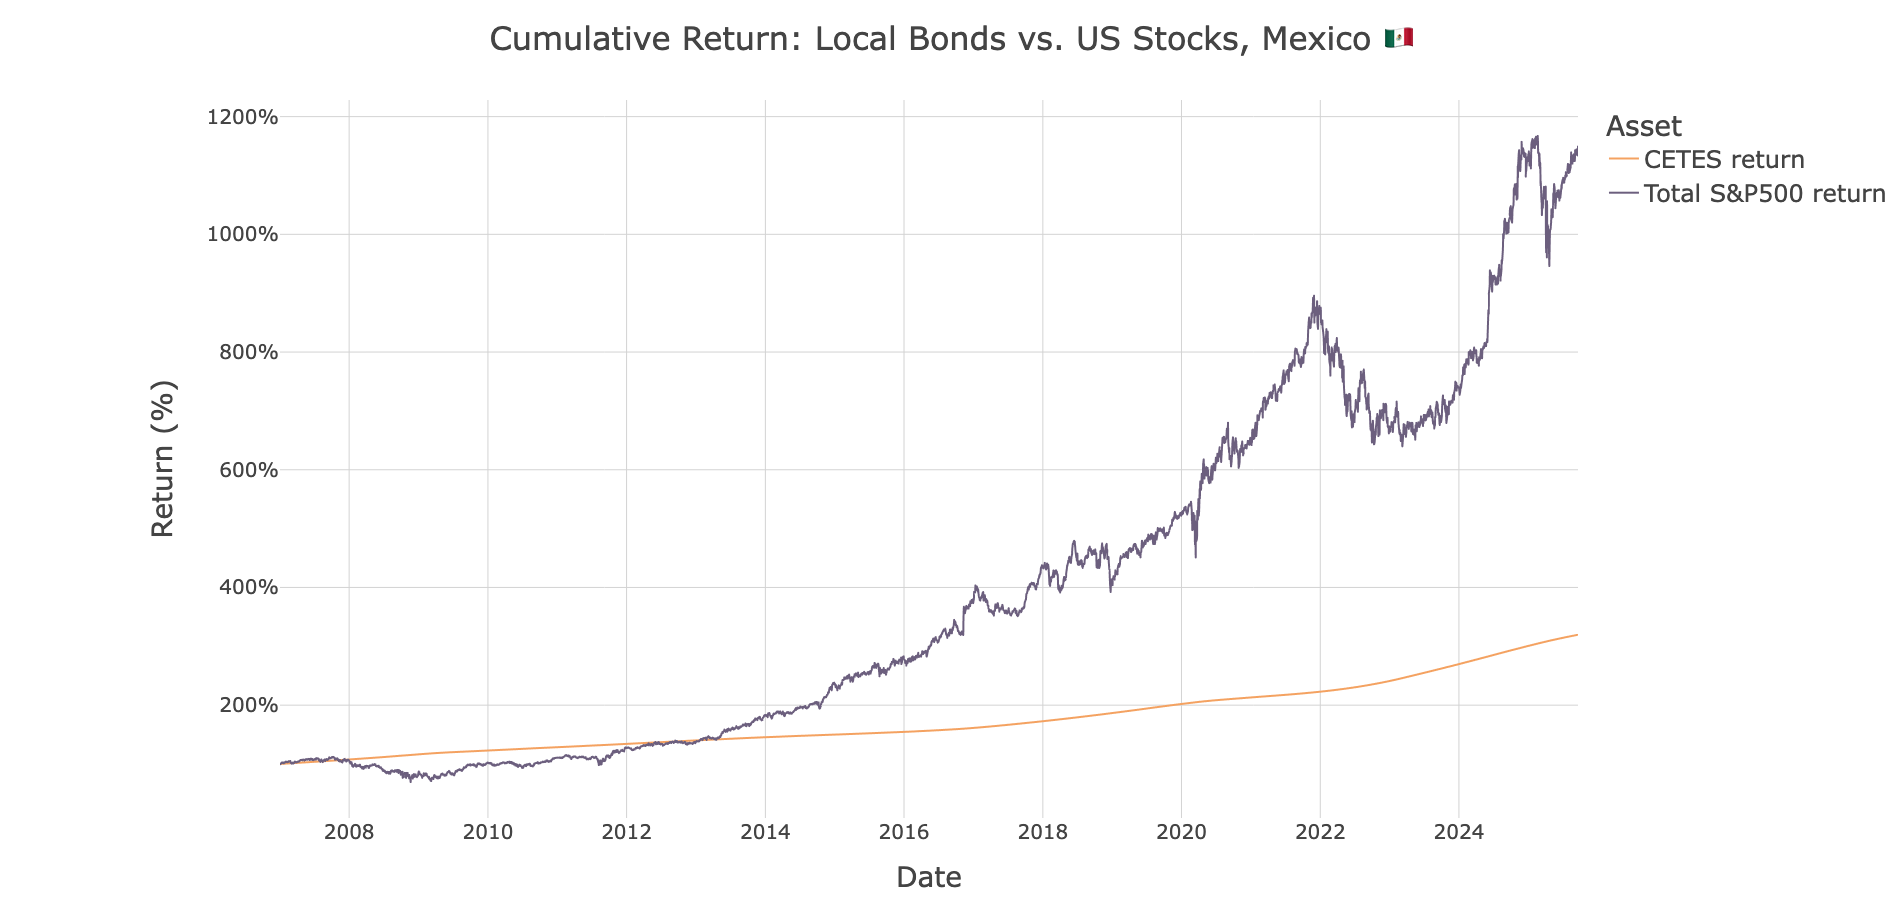
Over this 18-year period, U.S. equities delivered a total return of over 1,600% for Brazilian investors and nearly 1,200% for Mexican investors, decisively outperforming local bonds. This is a function of both the growth of the U.S. stock market, as well as the appreciation of the dollar over the time period, creating a double-compounding effect.
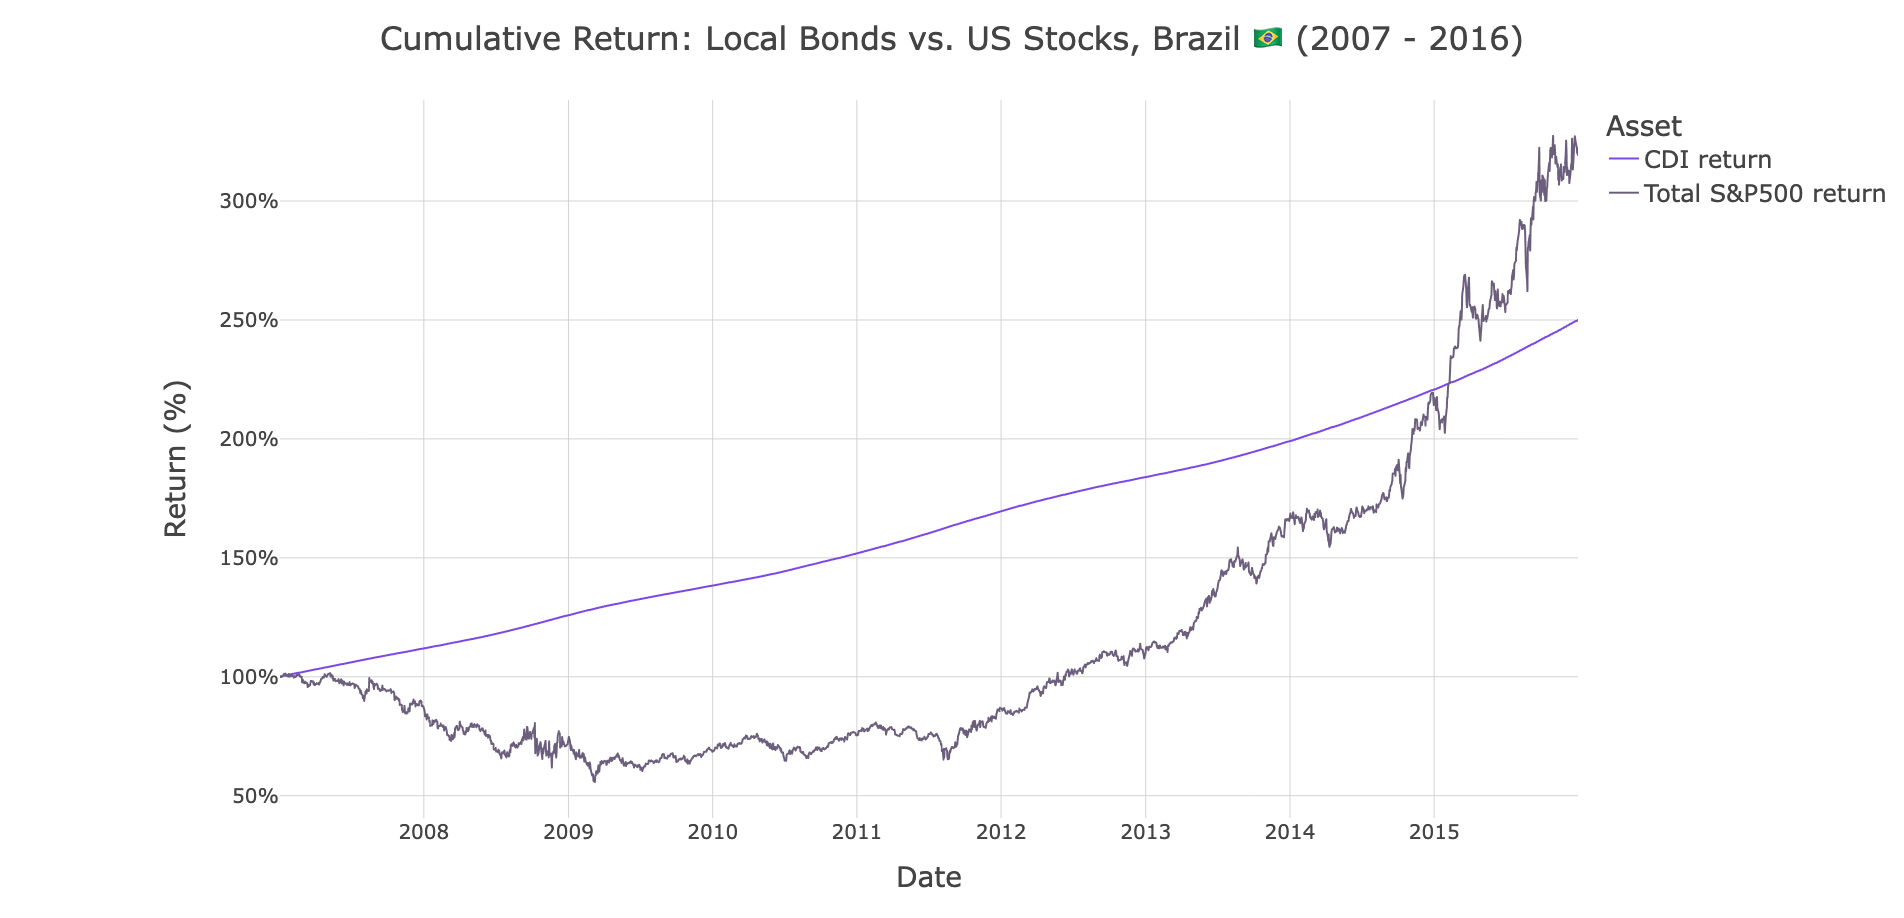
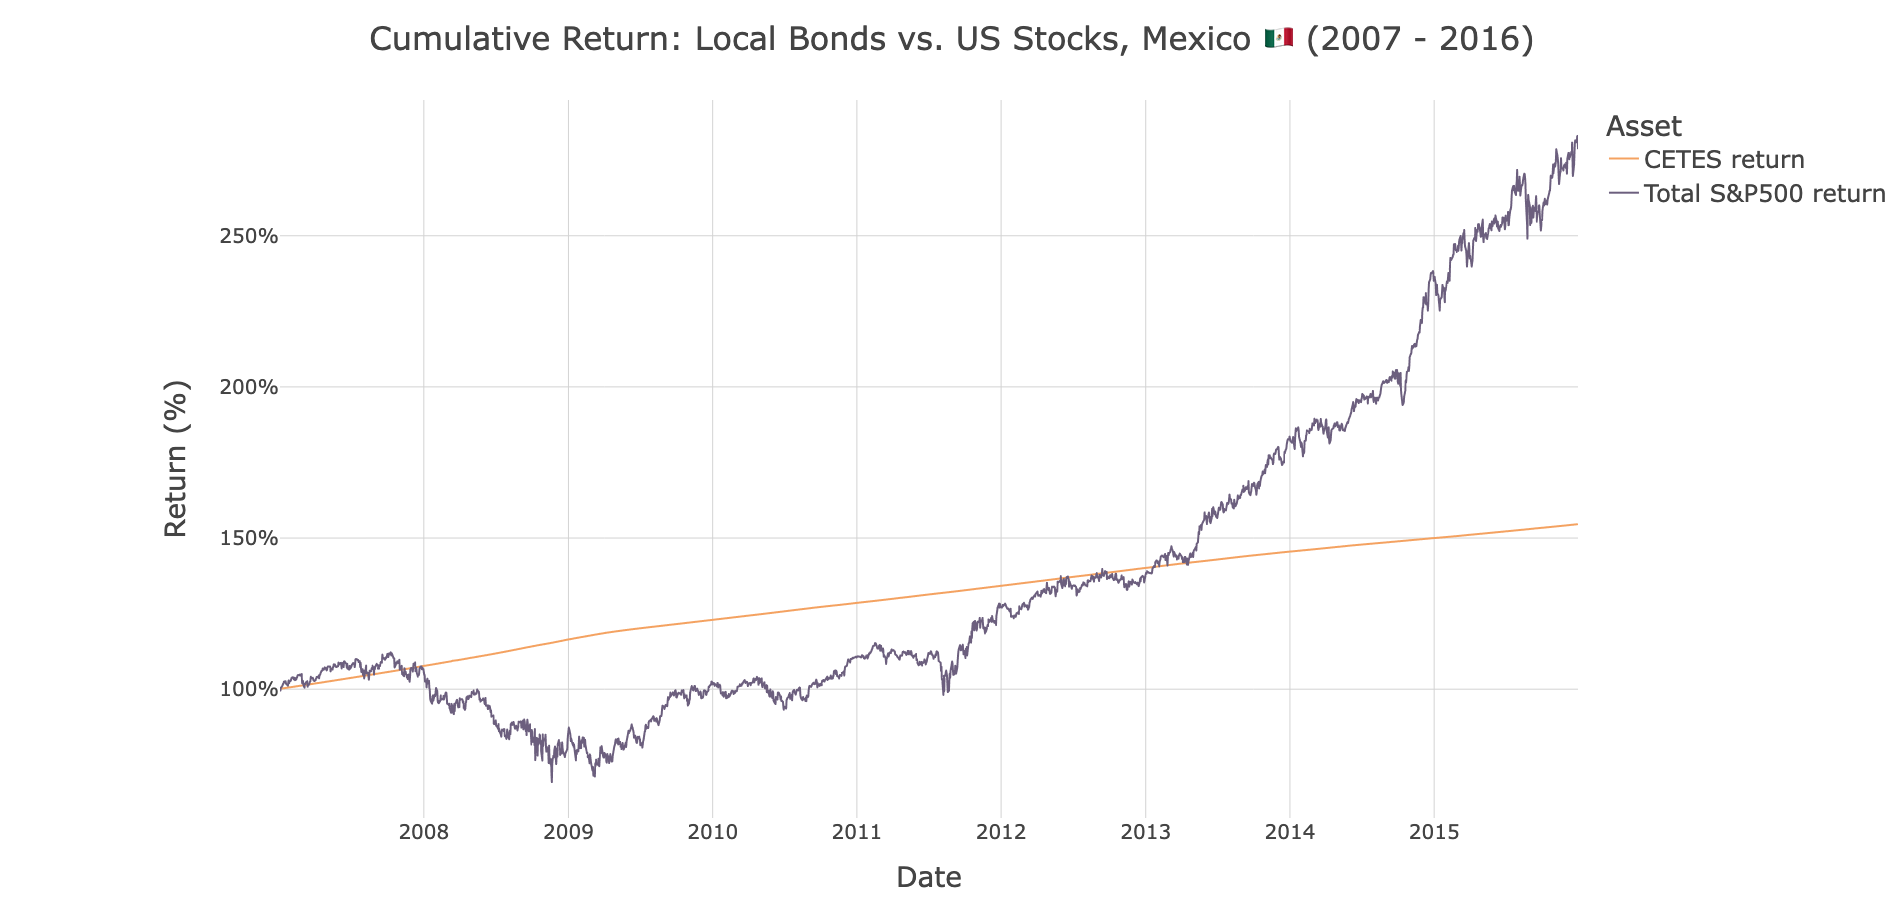
So why not just go all-in on U.S. stocks? Because even if they have generally gone up, they can go down as well. From 2007 to 2014 – for a period of 7 years – Mexican and Brazilian investors would largely have been better off sticking with fixed income:
The past doesn’t necessarily predict the future, but it’s the best that we have to work with if we want to make data-driven decisions. To understand the relationships between investing horizon, volatility, and return, we ran 100,000 simulations for each market, randomly picking different time intervals out of the full 18-year time window, and studying how portfolios with different mixes of stocks and local bonds performed.
Here’s what we found.
Results 📈
Portfolios go through “swings,” and the more stocks you own in your portfolio, the more vulnerable you are to these swings. These can be tough to handle emotionally: when you find yourself down 30 - 50% in a week, it can be hard to stay cool. As you build your portfolio, you need to be realistic about this. These charts show:
X-axis: How much of your portfolio is in U.S. stocks (from 0% to 100%).
Y-axis: The potential drop in your portfolio's value. The solid line is the typical drop in a downturn; the dotted line is the worst-case crisis scenario.
Color: The long-term reward. Yellow means higher annualized returns.
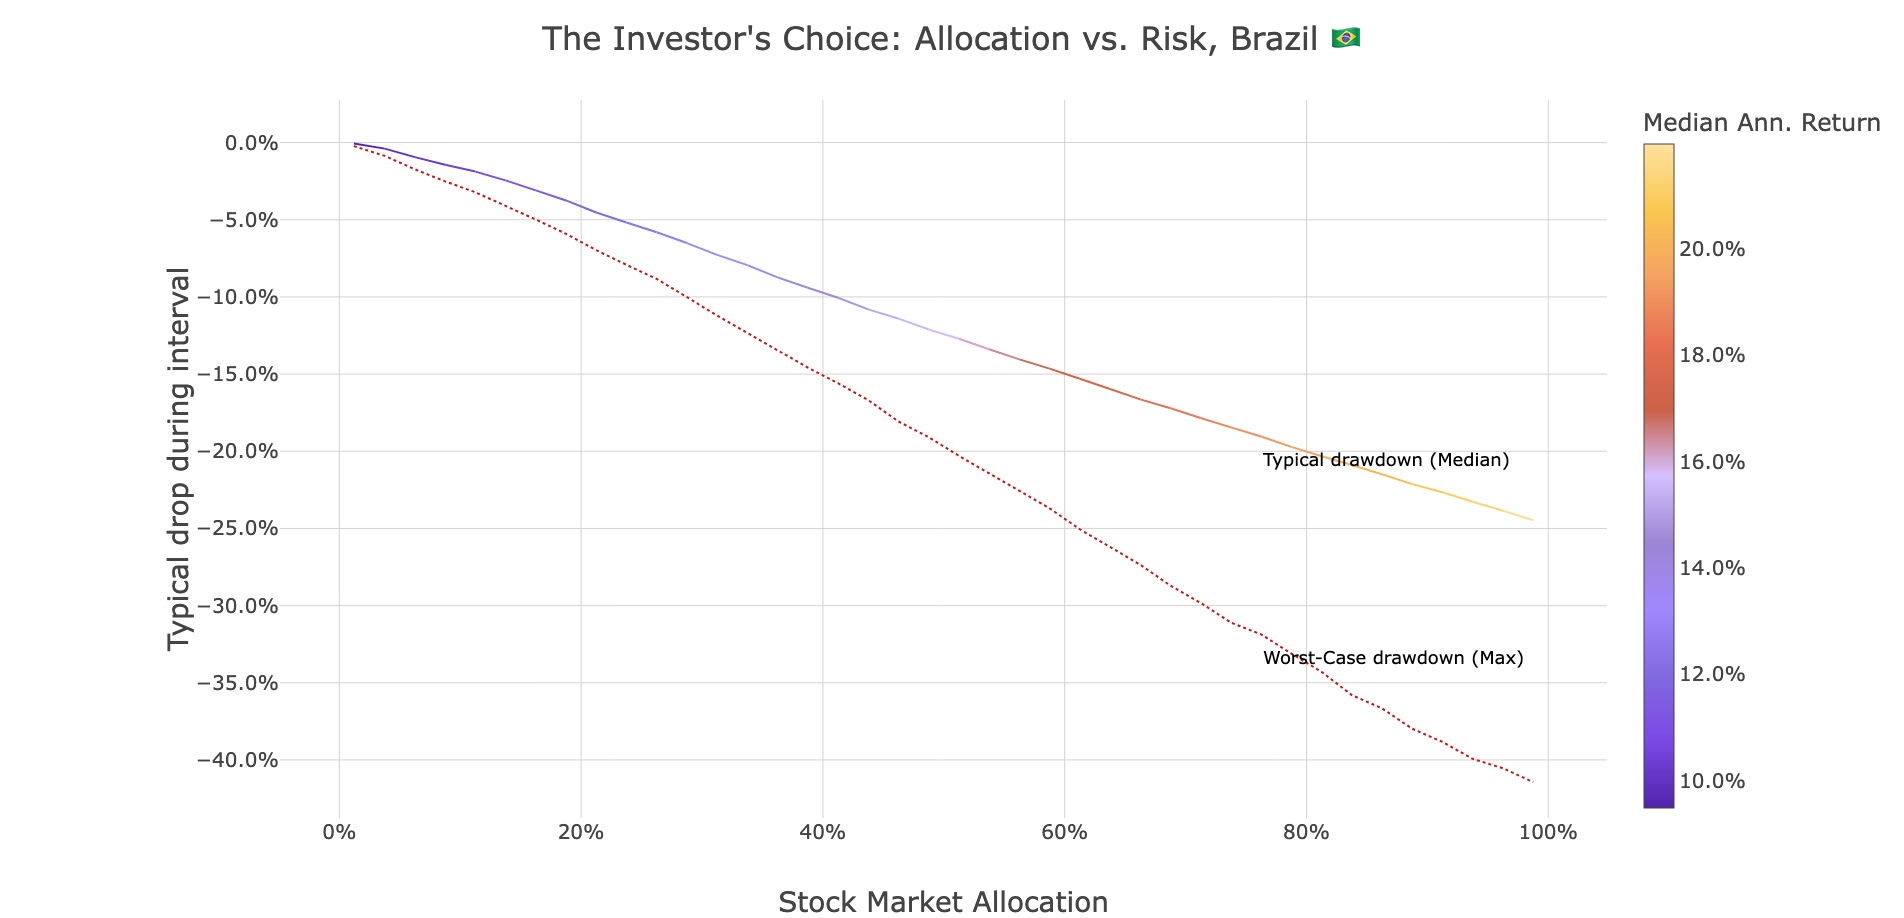
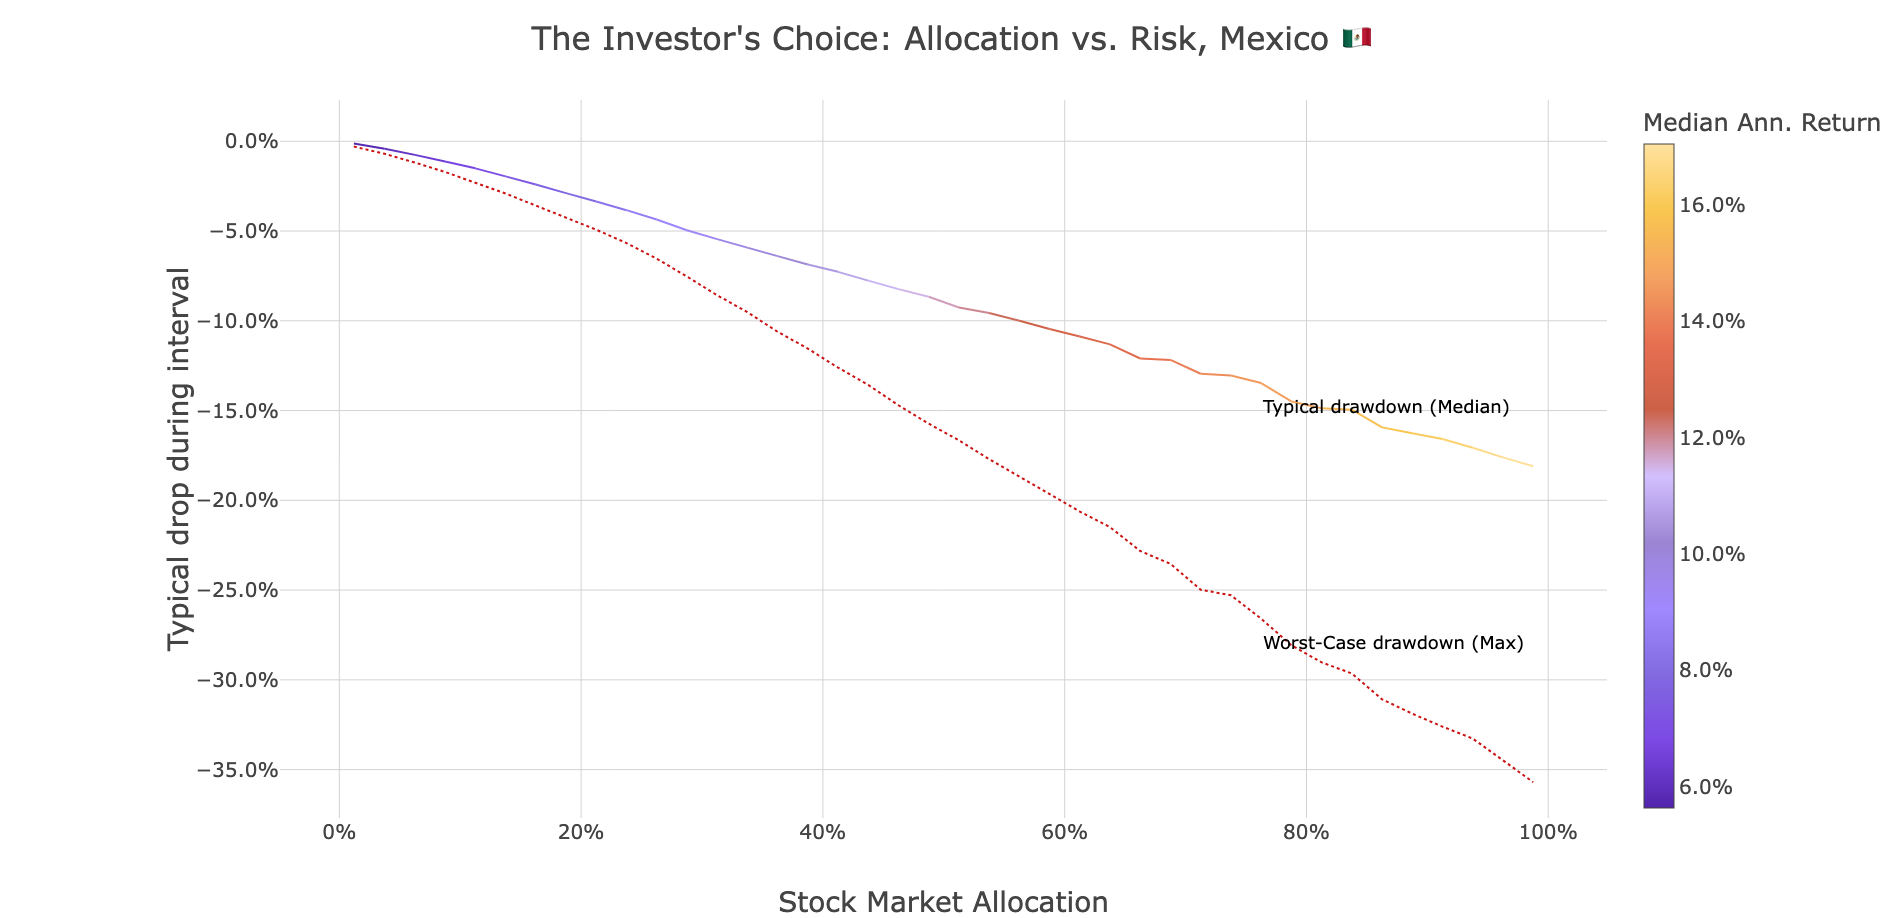
Allocation to U.S. stocks | Expected Annual Return | Typical “Swing” (drawdown) |
Brazil: 20% | ~12.0% | ~7.0% |
Mexico: 20% | ~8.2% | ~4.5% |
This is a low level of risk to accept in exchange for dramatically improved portfolio performance. Investors enjoyed much higher returns as they increased their allocation to U.S. stocks, however at the same time they increased their exposure to painfully large swings in portfolio value.
Those charts focus on risk. We can re-frame the analysis to make the relationship between stock market allocation and portfolio performance much more clear. These charts show:
X-axis: The percentage of S&P500 in the portfolio
Y-axis: Annualized annual return, both the “typical” return and “best case scenario”
Color: The risk of relatively large portfolio swings
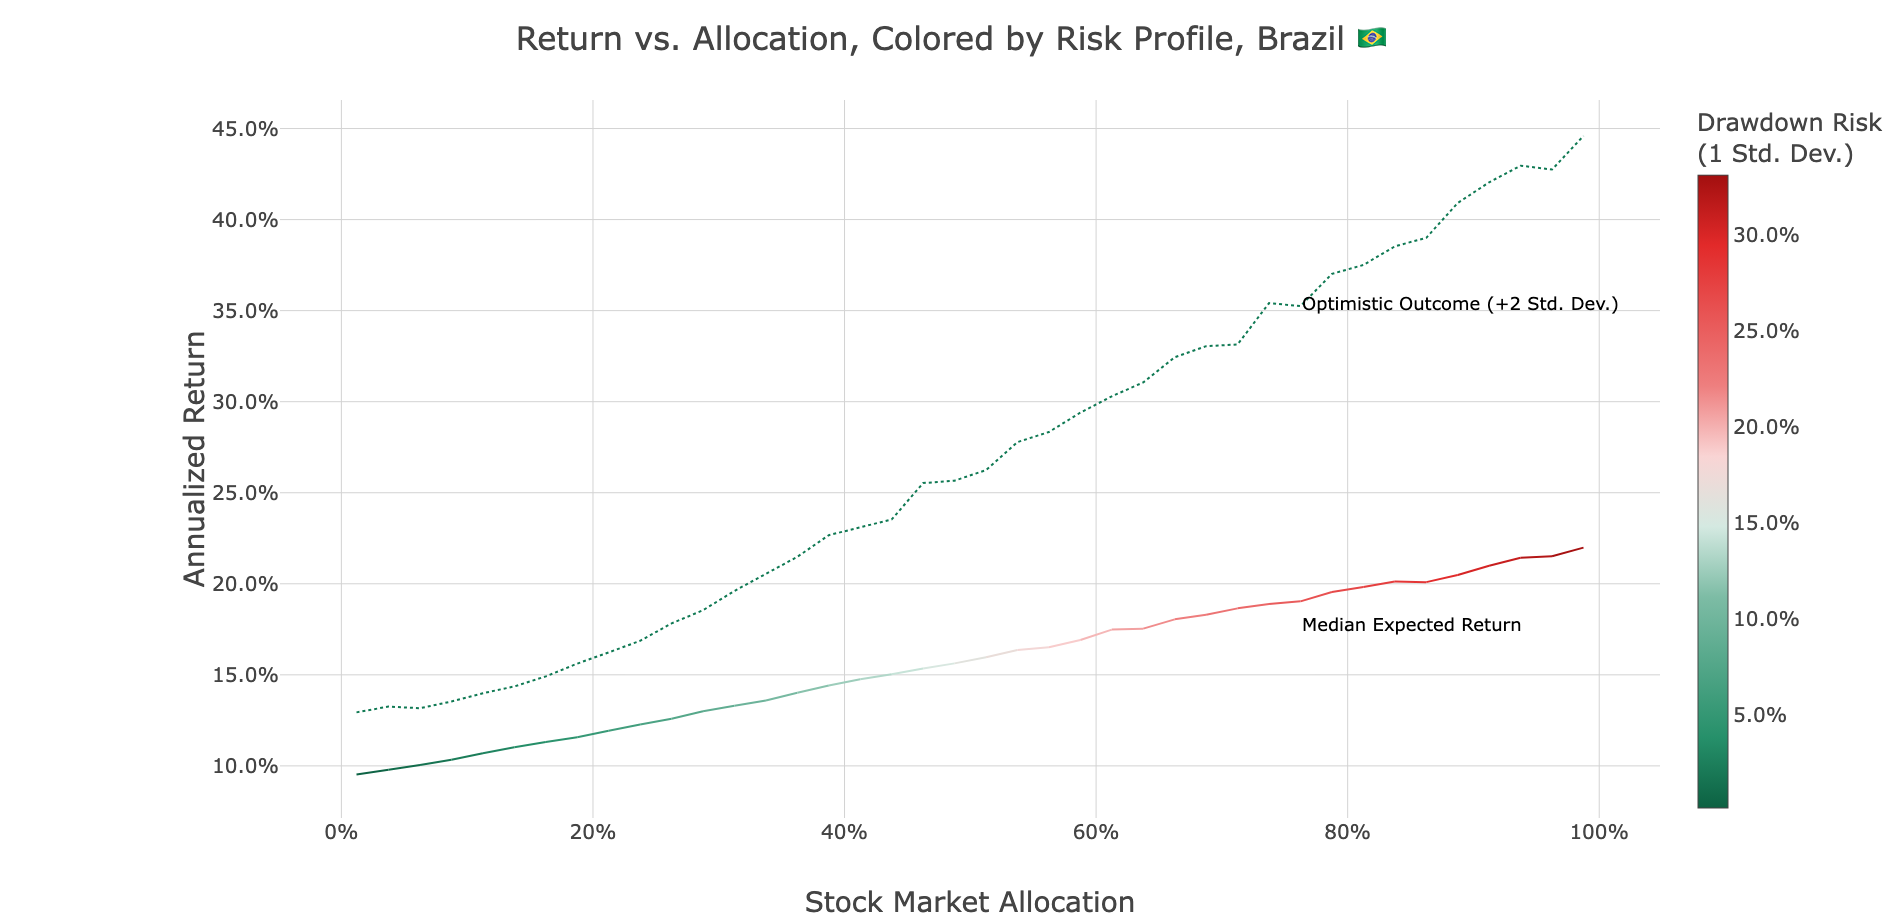
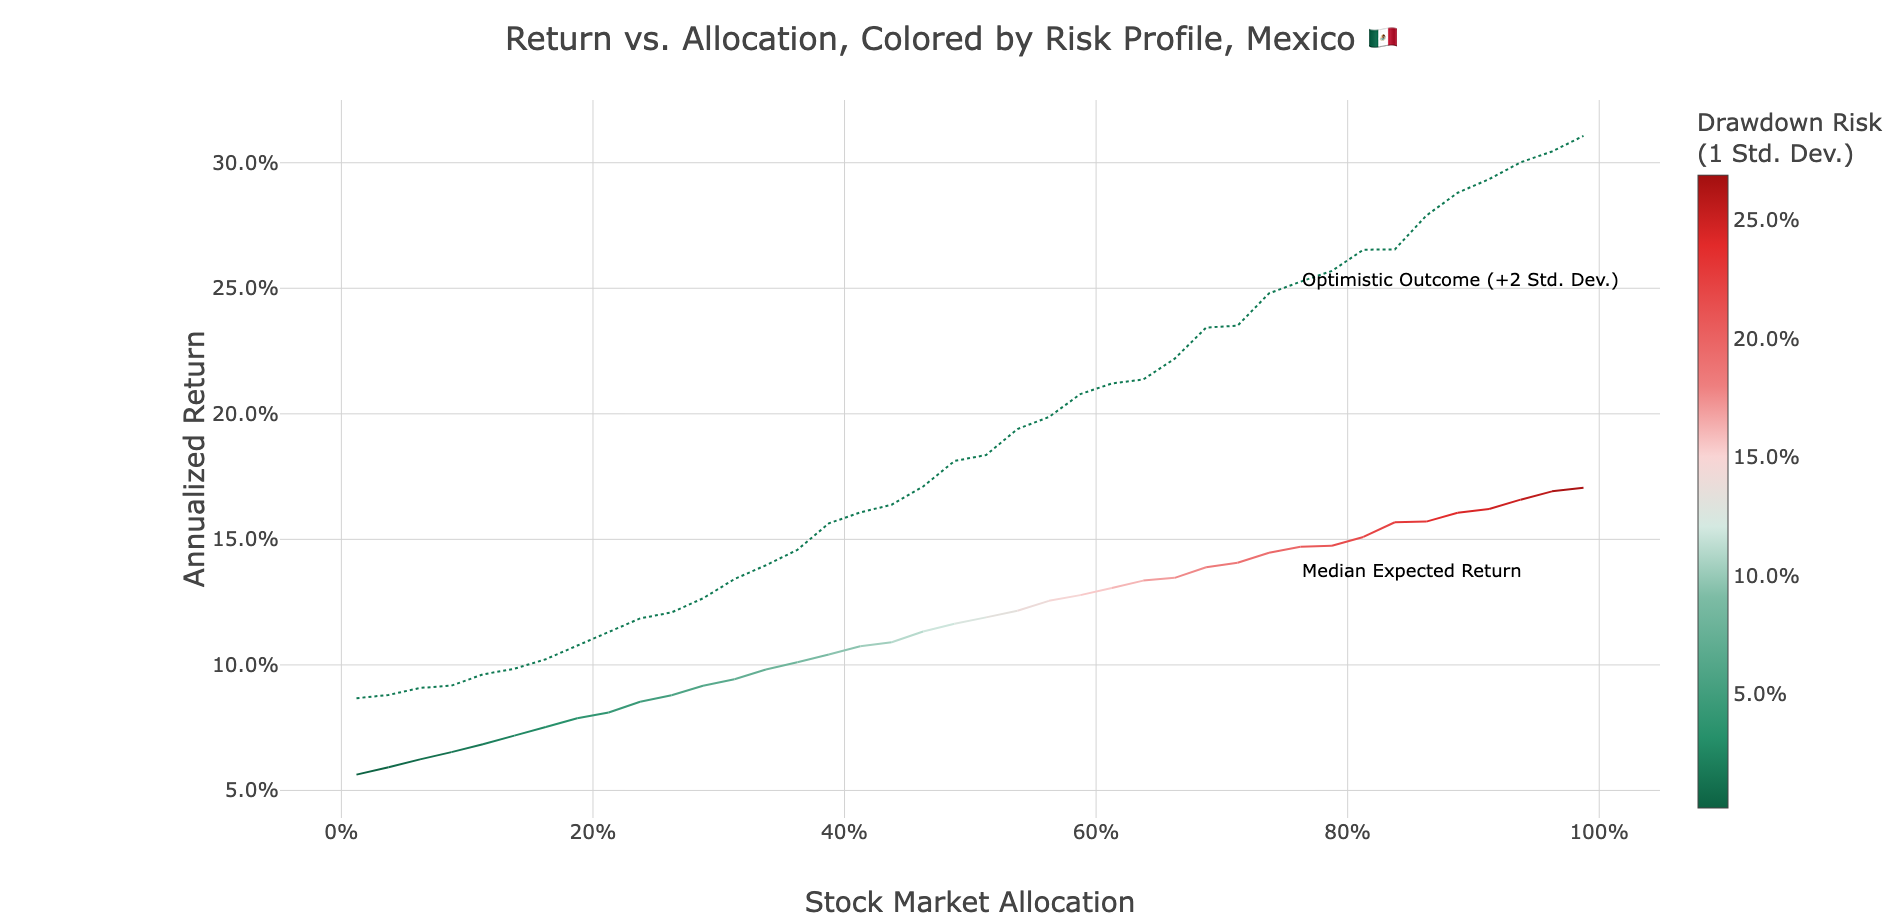
These charts generally tell the same story: more risk, more return. The key insight, however, is that even a very small amount of allocation to U.S. equities creates a lot of room for upside surprise: at just 1.2% S&P500 allocation, the predicted Brazilian portfolio return ranged between 9.5% and 13.1%. In Mexico, it ranged between 5.6% and 8.6%.
A key element not shown in these charts is time horizon. As you can see above, over a long period of time stocks do well, but over shorter periods of time, all of that volatility creates the risk of loss. These charts show:
X-axis: The percentage of S&P500 in the portfolio
Y-axis: the probability that your portfolio was worth less at the end of the period than the beginning
Color: The time horizon that you are investing on
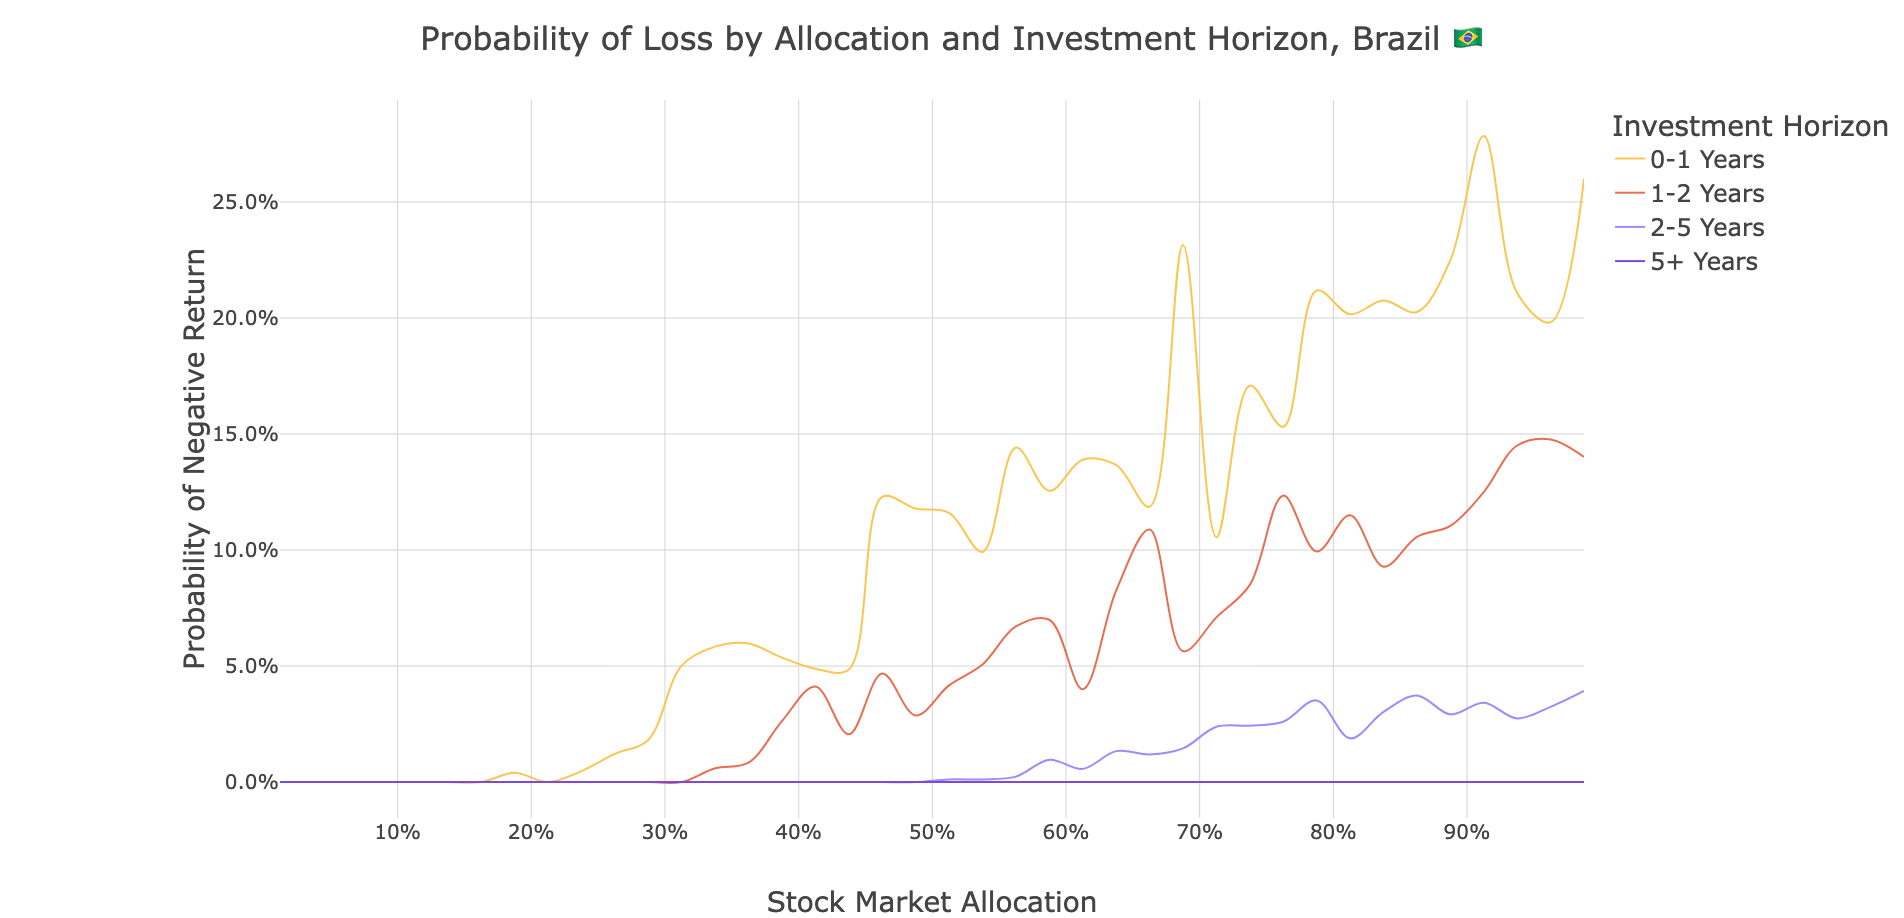
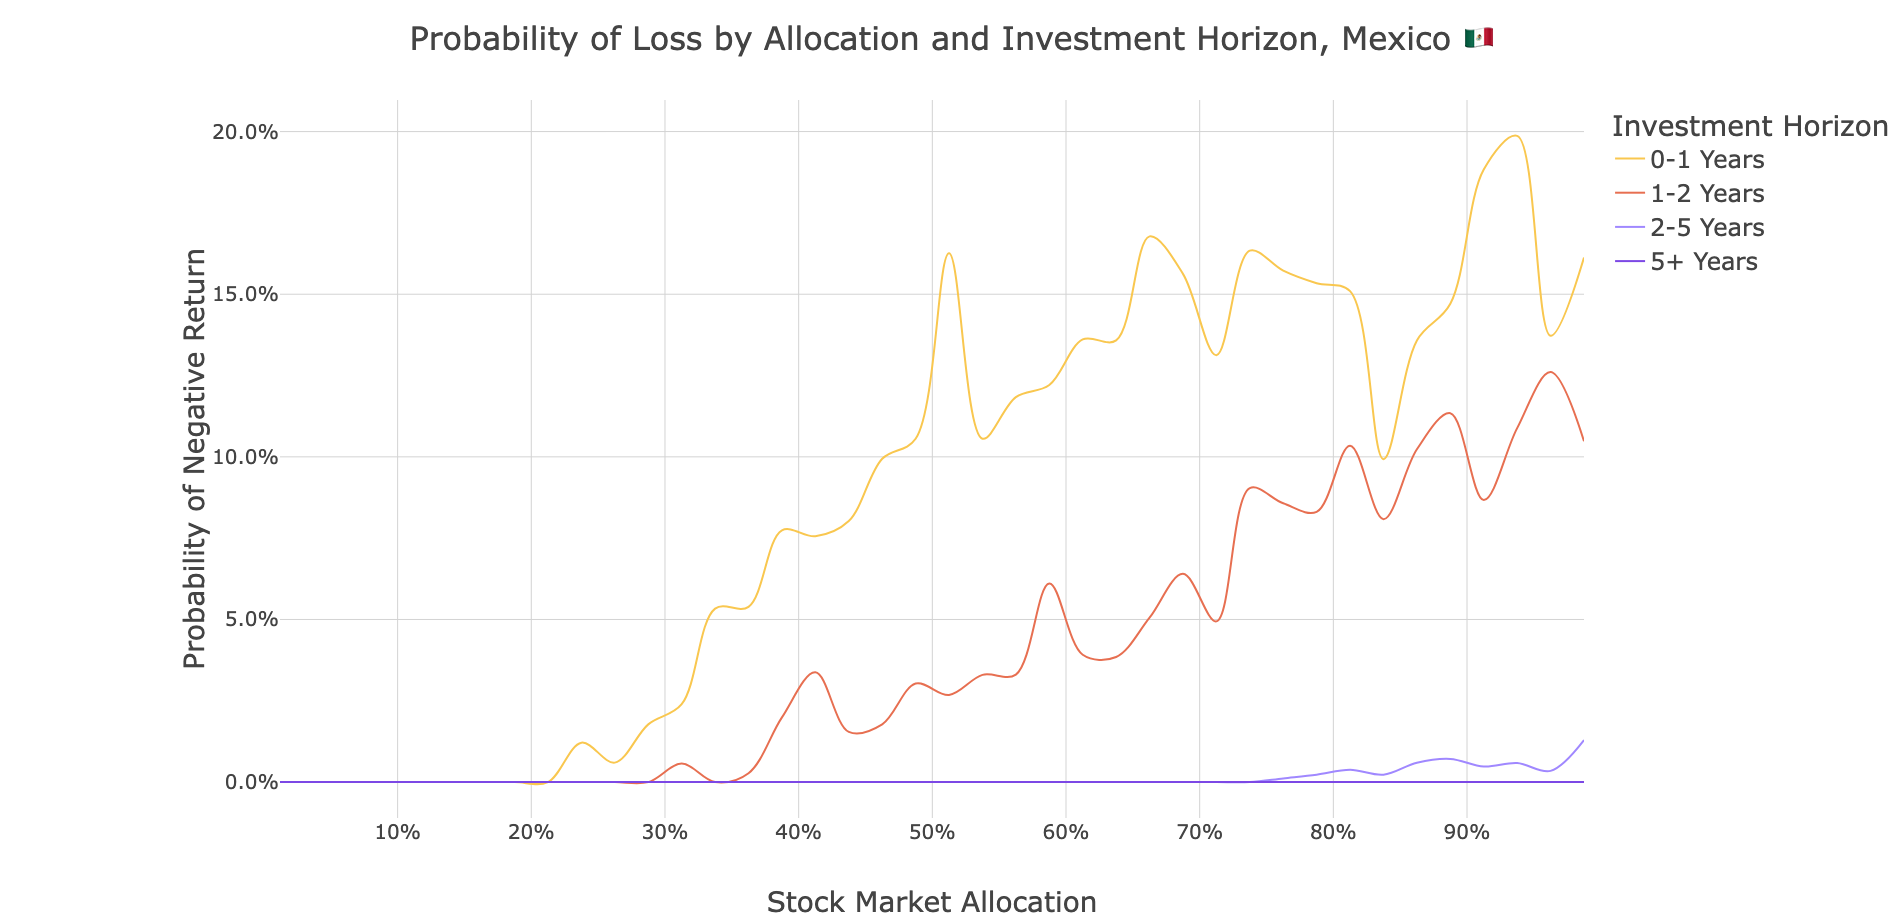
This may be the single most important finding of our entire analysis: In 100,000 simulations, no portfolio with a 20% or lower allocation to U.S. stocks ever lost money over any time period. This suggests that a baseline allocation to U.S. equities has historically been a remarkably safe way to enhance returns.
So what? 🤔
This analysis shows how diversification can be a powerful tool of financial empowerment. With Vest, you can easily access the U.S. market, dollarize your money, and leverage the power of compound interest USD appreciation to meet your financial goals and risk profile. We're working hard every day to make that exercise as intuitive as possible. The math is clear:
For the "Safety First" Investor / short-term investor (1-3 Year Horizon): Our data shows a 20% allocation to U.S. equities is the sweet spot. It has historically never lost money over any period while significantly boosting returns.
For the "Balanced Growth" / medium-term investor (3-7 Year Horizon): The right mix for these investors was 50% to U.S. stocks from Brazil, and around 70% from Mexico. This allocation captures a large portion of the U.S. market's upside while keeping the typical drawdowns manageable.
For the "Maximum Growth" / long-term investor (7+ Year Horizon): For those with a long time horizon and the stomach for volatility, a 90-100% exposure has historically delivered the highest returns, as the power of compounding growth and currency hedging overwhelmed any short-term downturns.
One important point: if you don’t have enough savings tucked away to pay for your current lifestyle for 3 - 6 months, do that, first. Build up that safety buffer100% in local fixed income before you think about making riskier investments abroad.
There are important factors that we don’t consider here, and before making any big choices consult with a financial planner or a knowledgeable person who you trust. These include:
Local fixed income is often tax sheltered, whereas earnings abroad are not. E.g., as of this year the Brazilian government charges 15% to bring earnings home from abroad.
Our analysis doesn’t account for forex fees and taxes on foreign exchange: these costs end up reducing your final return by 3 - 5% when investing in the U.S.
Interest rates and stock markets go up and down, and the world is changing quickly. Having that 3 - 6 months of savings tucked away allows you to roll with the punches and adjust your strategy to match new realities.
🚀 At Vest, your financial freedom is our mission. In the coming weeks we are:
Adding stablecoin-based forex options to the app, allowing you to enjoy lower fees and even more responsive transaction times. This is live today in Brazil, and coming very soon for all of our global markets.
Incorporating these insights into Vest AI while allowing it to compose and trade portfolios suited to your objectives and time horizon. Investing should be as easy as getting from point A to point B in a fully self-driving car.
Launching a debit hard to allow you to spend in USD while abroad. We know that it’s important to be able to use those dollars when you travel abroad!
Our goal is to give you the data and the tools to make smarter, more confident decisions. The right path forward is the one that aligns with your timeline and your temperament, and we're here to help you find it.
👉🏽 Is there anything else you’d like to learn about that we didn’t cover here? Send us a note at support@mivest.io.
Securities offered by Northbound Securities, LLC. Member FINRA/SIPC. The opinions in the preceding commentary are as of the date of publication and are subject to change. Information has been obtained from third party sources we consider reliable, but we do not guarantee the facts cited are accurate or complete. This material is not intended to be relied upon as a forecast or investment advice regarding a particular investment or the markets in general, nor is it intended to predict or depict performance of any investment. We may execute transactions in securities that may not be consistent with the report’s conclusions. Investors should consult their financial advisor on the strategy best for them. Past performance is no guarantee of future results. For illustrative purposes only. Does not represent an investment recommendation. For more information, please see our Social Media Disclosure.